
Updated at the beginning of each month
Date of Update: 6/30/26
Stock Market in 2022: -19.5% (Start of Year 474.82, End 382.43)
Stock Market in 2023: +24.2% (Start of Year 382.43, End 475.34)
Stock Market in 2024: +23.2% (Start of Year 475.34, End 586.08)
Stock Market in 2025: +17.72%
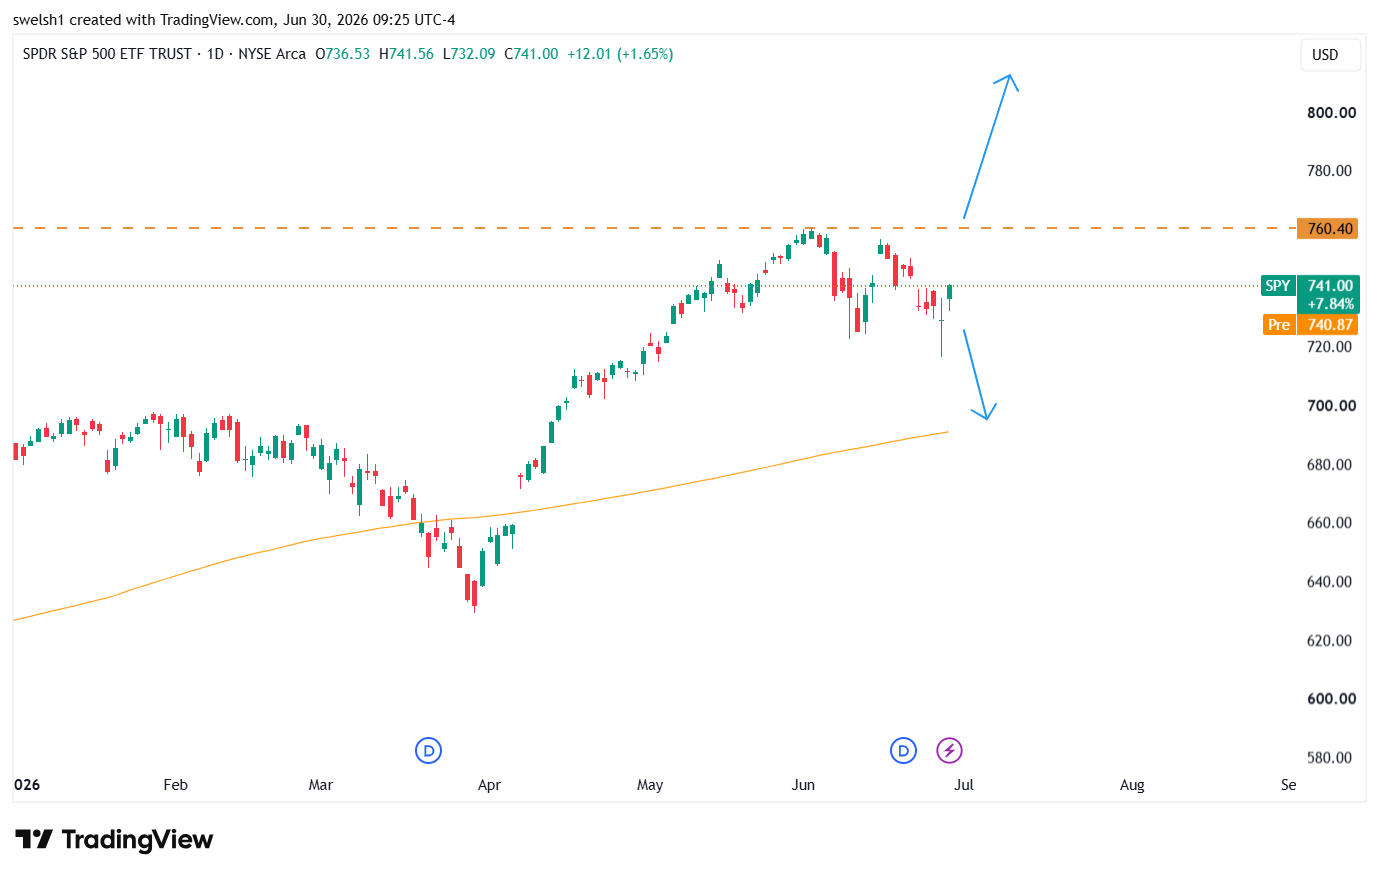
Stock Market in 2026: +7.04%
FUTURES
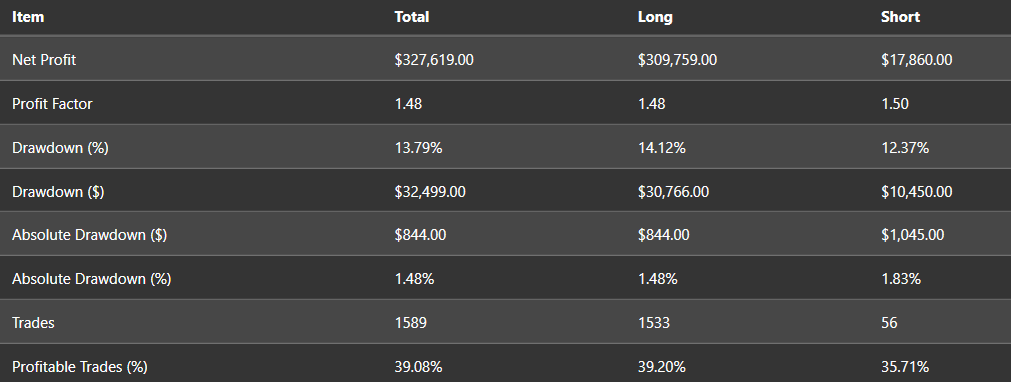
Portfolio: Simple High-Percentage Portfolio on Indexes (& Gold)
Idea: Use high-percentage strategies on the stock indexes to create a market-beating portfolio. Are Futures the most reliable, most diversifiable way to create profit? New video on this portfolio (5M RSI Trend, Daily RSI, 240M CCI) can be seen HERE. Starting on 5/1/24, we're adding a Gold strategy to this portfolio.
(Reports generated via Portfolio Architect.)
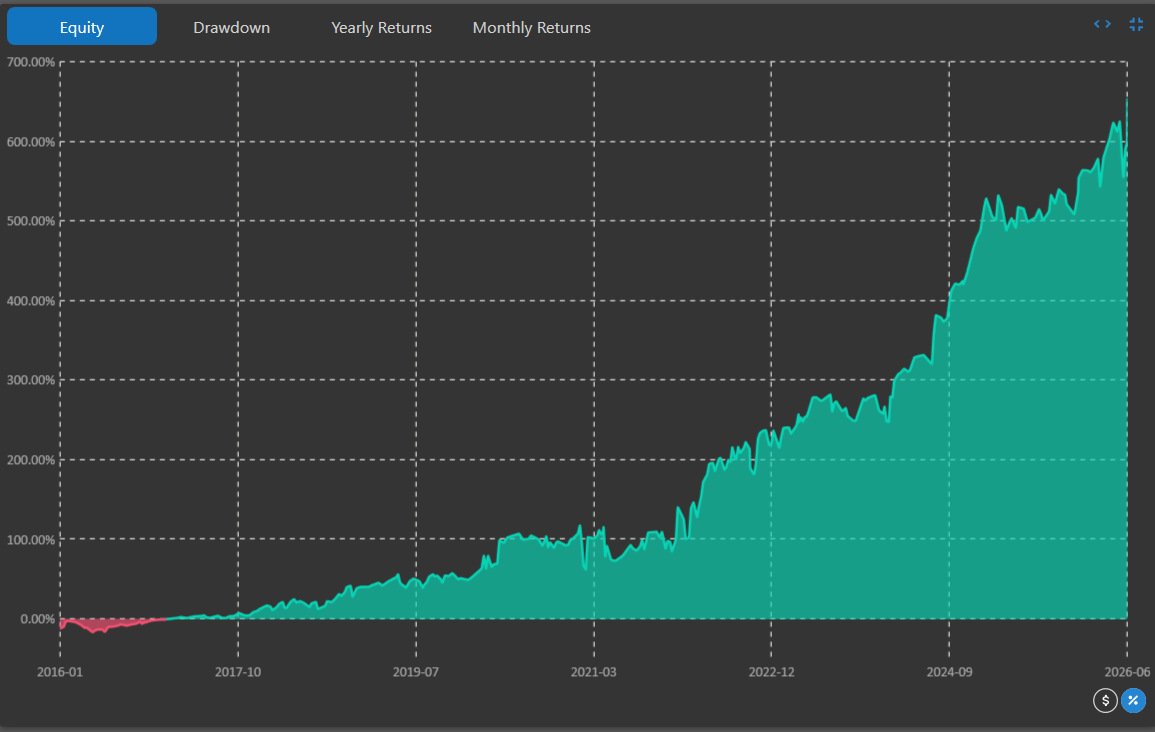
Performance Report since 2016 (trading 1 contract each time on a sample $57k account):
Equity Curve Since 2016:
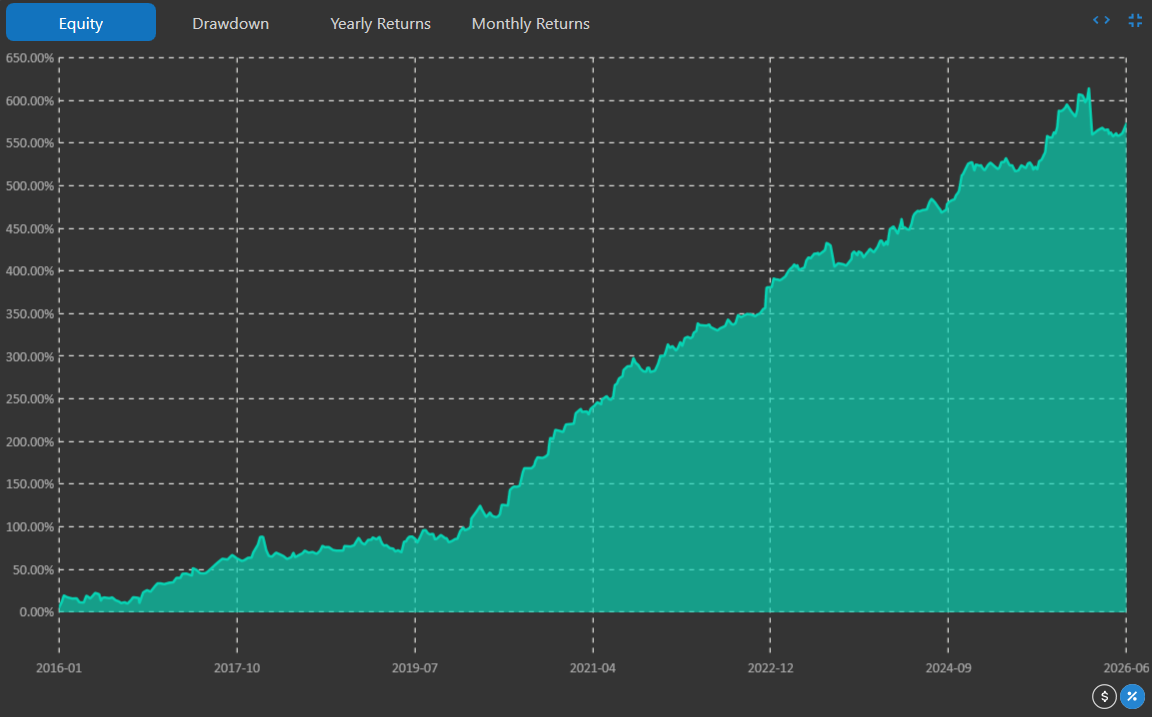
Hypothetical Return on a $57k account since 2016: +574%
SPY Hypothetical Return since 2016: +337% (including dividends)
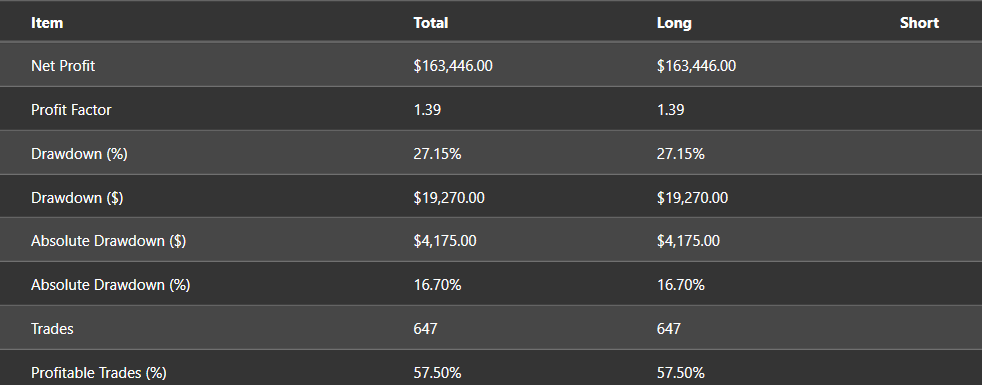
Portfolio: The NQ Overnight Pullback System
Idea: Data shows that most of the stock market's gains come overnight--not during the trading day. This strategy tries to exploit this phenomenon.
A new video on this portfolio is HERE and the update is HERE.
(Reports generated via Portfolio Architect.)
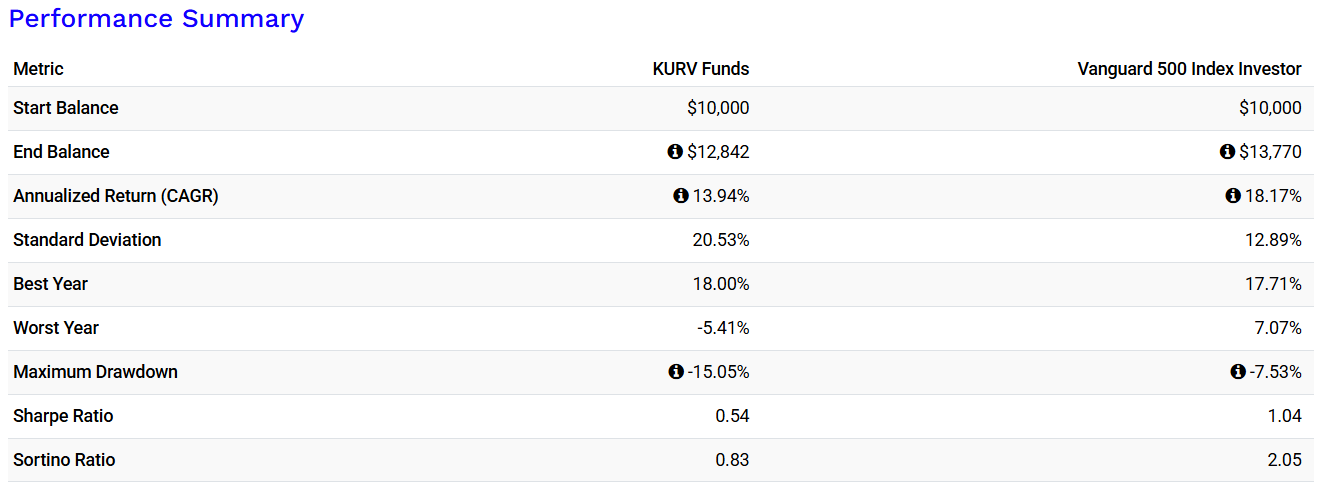
Portfolio: Medium-Yield No NAV-Erosion Portfolios from KURV & NEOS
Idea: What if we go for income but don't want to see our nest egg erode over time? What if we want income but want to see our account grow a little also?
Performance of KURV from 8/1/24-now (all dividends and distributions reinvested & portfolio rebalanced annually):
Performance of NEOS from 11/1/24-now (all dividends and distributions reinvested & portfolio rebalanced annually):
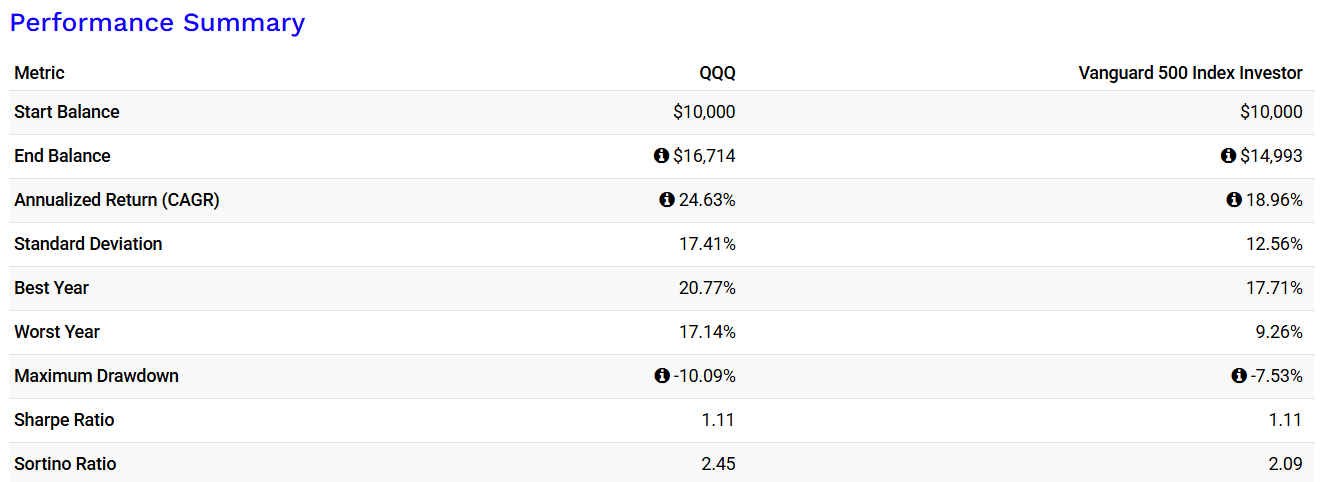
Portfolio: Income from Only Growth
Idea: What if we want as much growth as possible and then will take our monthly/yearly income strictly from that growth?
Performance of QQQ from 3/1/24-now (all dividends and distributions reinvested):
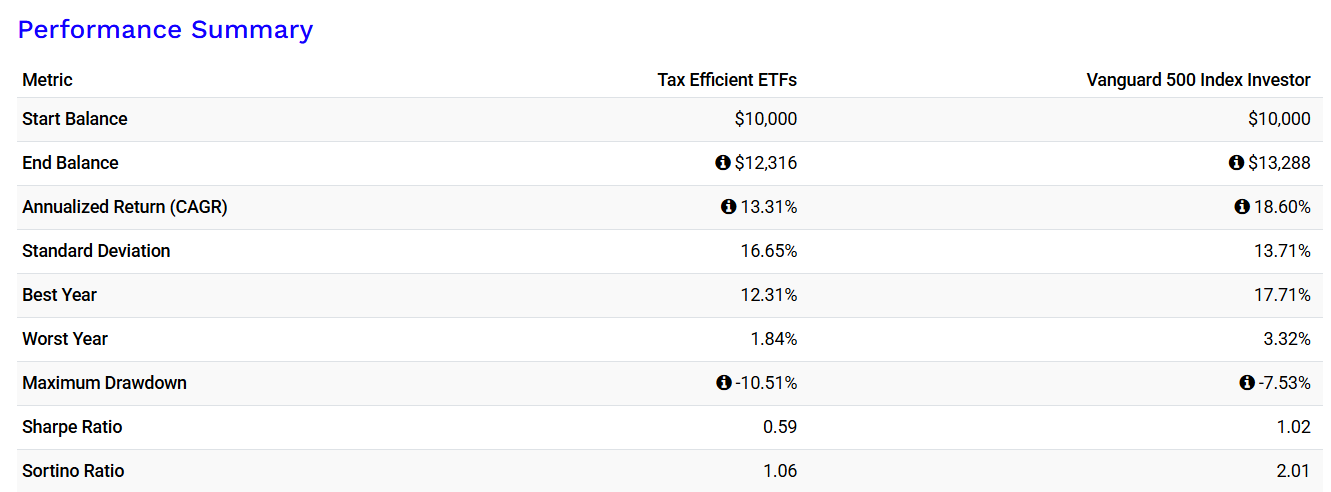
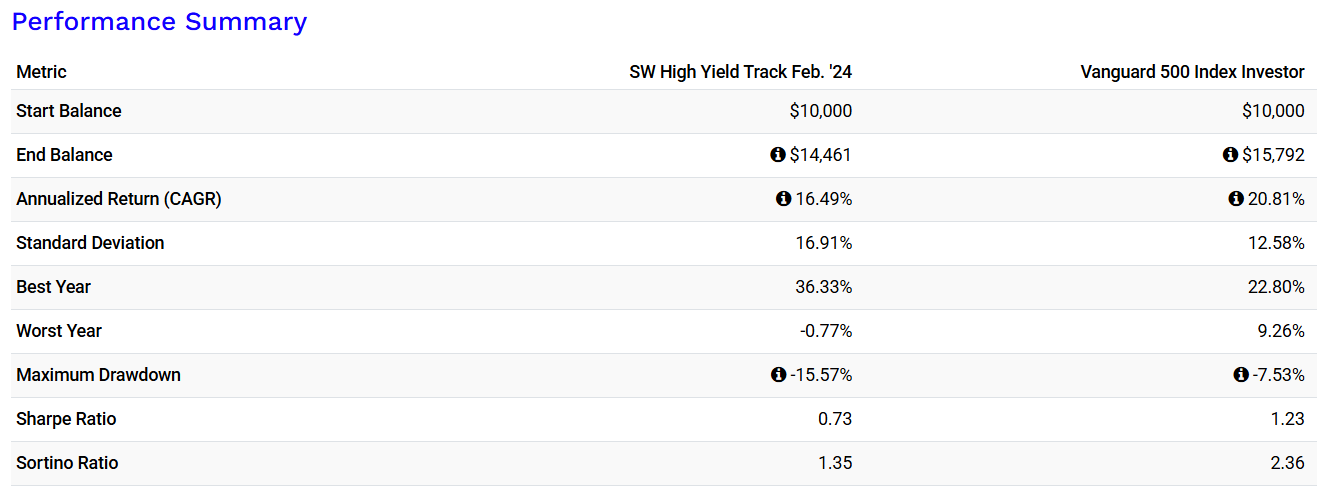
The "High-Risk" High-Income Portfolio (watch the video on this portfolio HERE)
Returns since 2/1/24 (all dividends and distributions reinvested & portfolio rebalanced annually):
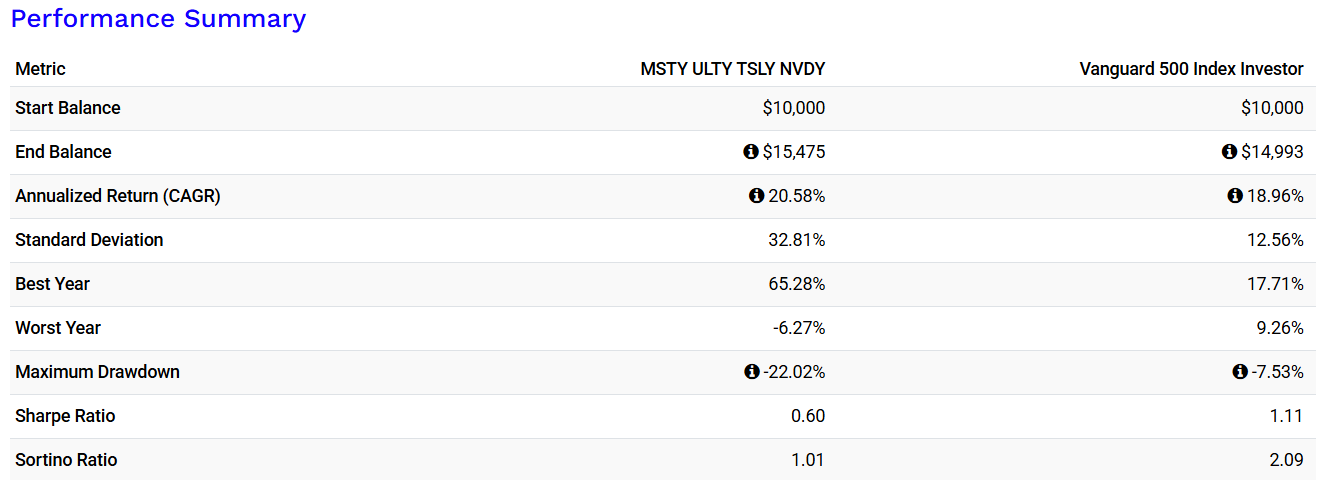
Portfolio: Super "High Risk"/High Income Portfolio
Idea: What if we go for max income via 4 super high-yield ETFs? Will it thrive, pay itself off, and provide life-changing income? Or will it crash and burn?
Performance from 3/1/24-now (all dividends and distributions reinvested & portfolio rebalanced annually):
Disclaimer: THIS IS NOT FINANCIAL ADVICE.
It should not be assumed that the methods, techniques, or indicators presented in these products will be profitable or that they will not result in losses. Past results are not necessarily indicative of future results. Examples presented on these sites are for educational purposes only. These set-ups and portfolios are not solicitations of any order to buy or sell. The authors, the publisher, and all affiliates assume no responsibility for your trading results. There is a high degree of risk in trading and investing.
HYPOTHETICAL OR SIMULATED PERFORMANCE RESULTS HAVE CERTAIN INHERENT LIMITATIONS. UNLIKE AN ACTUAL PERFORMANCE RECORD, SIMULATED RESULTS DO NOT REPRESENT ACTUAL TRADING. ALSO, SINCE THE TRADES HAVE NOT ACTUALLY BEEN EXECUTED, THE RESULTS MAY HAVE UNDER- OR OVER-COMPENSATED FOR THE IMPACT, IF ANY, OF CERTAIN MARKET FACTORS, SUCH AS LACK OF LIQUIDITY. SIMULATED TRADING PROGRAMS IN GENERAL ARE ALSO SUBJECT TO THE FACT THAT THEY ARE DESIGNED WITH THE BENEFIT OF HINDSIGHT. NO REPRESENTATION IS BEING MADE THAT ANY ACCOUNT WILL OR IS LIKELY TO ACHIEVE PROFITS OR LOSSES SIMILAR TO THOSE SHOWN.
